


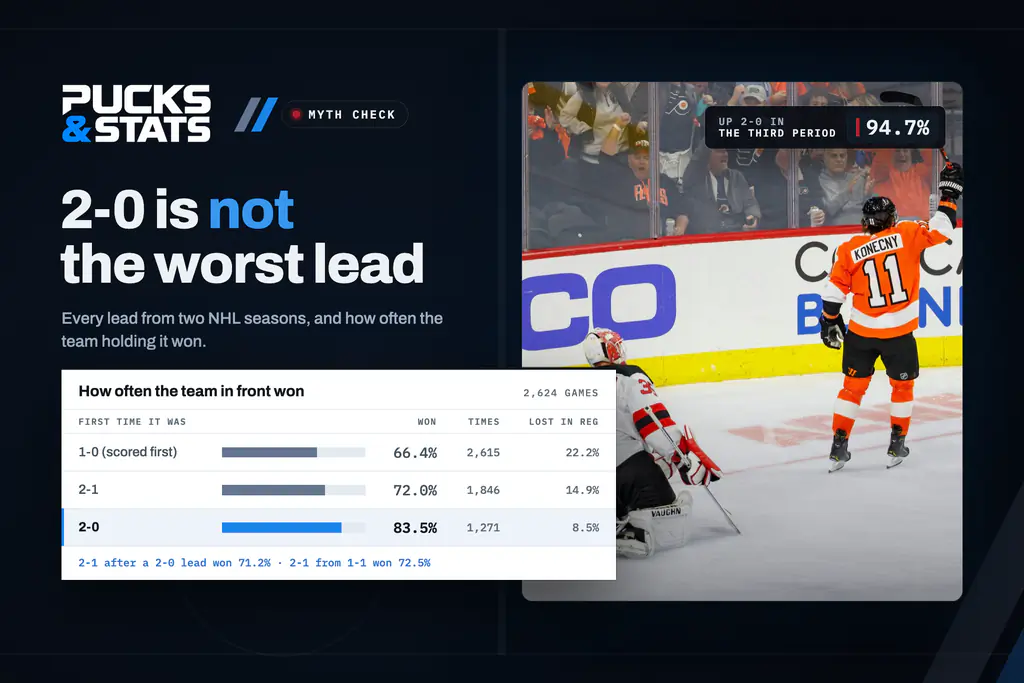
Hockey has a saying that 2-0 is the worst lead in the game. The idea is that the team in front relaxes, the first goal against swings the momentum, and a comfortable night turns into a fight. We checked it against every regular-season game of the last two seasons, all 2,624 of them. Teams that went up 2-0 won 83.5% of the time. A 1-0 lead won 66.4% and a 2-1 lead 72.0%. Only leads of three goals were safer.
Every lead, and how often it held
The table counts each score the first time a game reached it in regulation, and whether the team in front went on to win, in regulation, overtime or a shootout. A lead lost in regulation earned no point at all.
| Score | Times | Team in front won | Lost in regulation |
|---|---|---|---|
| 1-0 | 2,615 | 66.4% | 22.2% |
| 2-0 | 1,271 | 83.5% | 8.5% |
| 2-1 | 1,846 | 72.0% | 14.9% |
| 3-0 | 613 | 94.8% | 2.0% |
| 3-1 | 1,149 | 91.6% | 2.7% |
| 3-2 | 1,123 | 77.6% | 9.2% |
| 4-0 | 262 | 99.2% | 0.8% |
| 4-1 | 638 | 97.5% | 0.9% |
| 4-2 | 688 | 94.3% | 1.7% |
| 4-3 | 493 | 81.7% | 5.5% |
Read down the one-goal leads and they get safer as the score climbs: 66.4% at 1-0, 72.0% at 2-1, 77.6% at 3-2 and 81.7% at 4-3. That is the clock more than the score. A game at 4-3 has usually been going a while, so there is less time left to tie it. Every two-goal lead sits above all of them. Who has scored first in the most games in a row this season is on our team streaks page.
What the saying gets wrong
The saying rests on what happens when the trailing team scores. So we looked at 2-1 leads two ways. When a 2-0 lead became 2-1, the team still in front won 71.2% of the time. When a team went up 2-1 from 1-1, it won 72.5%. Giving a goal back made the lead no shakier than any other one-goal lead.
When the lead came mattered more than how it came. A 2-0 lead taken in the first period held 79.7% of the time, one taken in the second 85.8% and one taken in the third 94.7%. Late in a game a trailing team has to pull its goalie, and the pull-the-goalie numbers show how rarely that works: down one, teams tied the game 15.4% of the time with the net empty, and down two 2.8%.
After two periods
The same pattern holds at the second intermission. Teams leading by one after two periods won 76.1% of the time, by two 90.9% and by three 96.8%. Of the 574 games tied after two, 225 went to overtime. A team that falls behind takes most of the shots from there on, and more shots barely move the result.
Who blows them, who comes back
Over the two seasons Colorado led by two goals or more in 88 games and failed to win two of them. Chicago led by two in 57 and failed to win 17, the most in the league, ahead of Pittsburgh (15 of 74) and Columbus (14 of 74).
Anaheim came back the most. It won 17 games in which it trailed by two goals or more, ahead of Dallas (14), Seattle (13) and Edmonton (12). Bigger comebacks are rare: 43 teams won after trailing by three or more in two seasons, 1.6% of games, and six of them from four goals down. Goals for and against for every club are on the team stats page.
How we measured it
We rebuilt the score of every regular-season game in 2024-25 and 2025-26 from our own goal data, goal by goal, and checked each one against the final. A lead counts the first time a game reached that score in regulation, so a 2-0 lead that became 2-1 counts once at 2-0 and once at 2-1. A win includes overtime and shootout wins. Overtime goals and shootouts are left out of the leads, and the nine games that were 0-0 after regulation had no lead to count.