


Over the last two regular seasons, a team trailing by one goal with its goalie pulled in the last six minutes tied the game 140 times in 909 tries, 15.4%. It gave up an empty-net goal 406 times, 45%. The empty-netters cost those teams nothing in the standings, because a 2-0 loss is worth as much as a 1-0 loss. Most of the ties earned at least a point, 134 of the 140, and 75 turned into wins.
Earlier ties more games
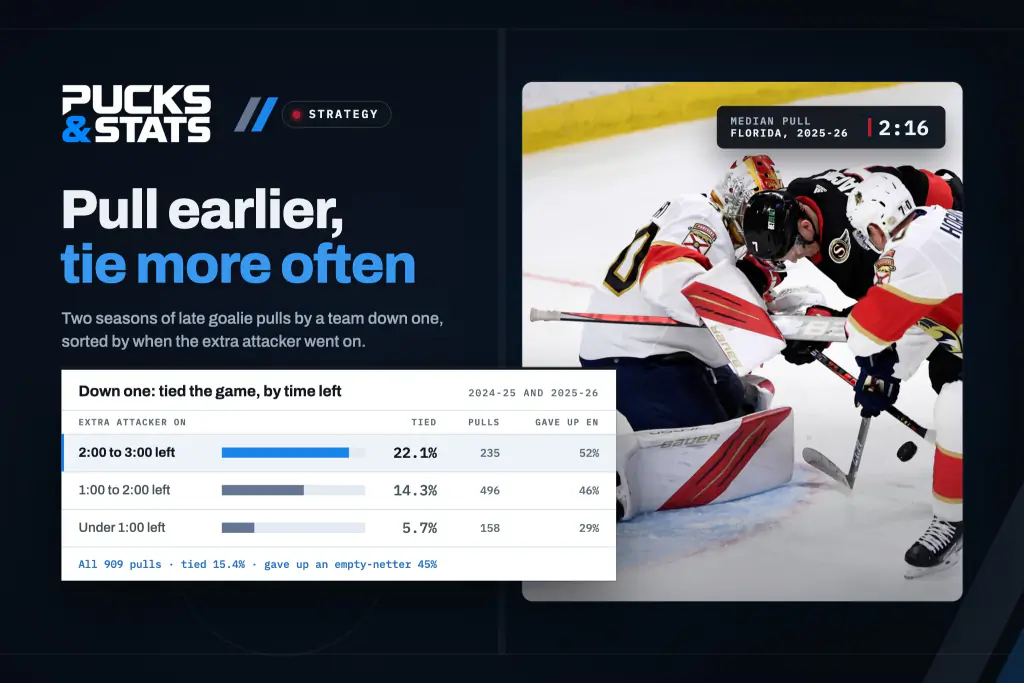
The clearest pattern is timing. We sorted every late pull by when the first shot attempt with the net empty came, a close marker for when the sixth skater went on. Teams that already had the extra attacker on with two to three minutes left tied the game 22.1% of the time. With one to two minutes left it was 14.3%, and under a minute 5.7%.
| First shot with the net empty | Times | Tied | Gave up an empty-netter | Won |
|---|---|---|---|---|
| More than 3:00 left | 20 | 8 (40%) | 7 (35%) | 4 |
| 2:00 to 3:00 left | 235 | 52 (22.1%) | 123 (52%) | 24 |
| 1:00 to 2:00 left | 496 | 71 (14.3%) | 230 (46%) | 42 |
| Under 1:00 left | 158 | 9 (5.7%) | 46 (29%) | 5 |
Going early also gave up more empty-netters, 52% against 46%. That is the trade the numbers keep pointing at: an empty-net goal against turns a one-goal loss into a two-goal loss, which changes only goal differential, while a tying goal usually earns a point and a chance at a second in overtime or the shootout. Only 20 of the 909 pulls started with more than three minutes left. Eight of them tied the game, but 20 is too few to say how much earlier would pay.
The usual moment is later. When a team trailed by one, the median first shot with the net empty came with 1:38 left in 2024-25 and 1:40 left in 2025-26.
What a tie is worth
Those 909 games still produced 209 standings points for the team that was behind. Of the 140 ties, 131 went to overtime or a shootout, a point each, and the trailing team won 72 of them for a second point. Three more were won in regulation, two points each. The other six were lost after all, when the leading team scored again before the horn.
Spread across the league that is about three points per team per season, and playoff spots have been decided by less. In the 2024-25 standings Montreal took the last Eastern wild card by two points over Columbus, and Calgary missed out on a tiebreaker, level with St. Louis at 96. St. Louis tied three of its 15 one-goal pulls that season and won two of those games. Calgary tied one of nine. This season’s race is on the wild-card standings.
Down two is a different game
Trailing by two, teams pulled the goalie earlier, with a median first shot at just under three minutes left, and it rarely worked. In 606 tries they tied the game 17 times, 2.8%, and won ten. They gave up an empty-net goal in 66% of them. Two goals in a few minutes is a lot to ask of six skaters, and a two-goal deficit is usually a loss either way.
Who goes early
Last season Dallas went to the extra attacker earliest when down one, with a median first shot at 2:42 left, but on only eight pulls. Among teams with more, Florida went earliest at 2:16, ahead of Colorado (2:12), the Islanders (2:02) and San Jose (1:58). Chicago went latest, at 1:13, then Toronto and St. Louis (1:15), Columbus (1:21) and Vegas (1:23). These are 8 to 22 pulls per team, so a few games can move a team up or down.
Over the two seasons the results spread just as widely. Anaheim tied 11 of its 36 one-goal pulls and won eight of those games. Vegas tied 8 of 28 and gave up only five empty-netters, and Montreal tied 7 of 25. At the other end, Chicago pulled its goalie down one more often than anyone, 40 times, tied twice and gave up an empty-net goal in 24 of them, and Utah tied once in 30.
Empty-net goals are now about 6.5% of all NHL goals: 524 in 2024-25 and 508 in 2025-26. Shootouts are their own story, told here.
How we measured it
Every shot attempt in our shot data carries the on-ice situation: how many skaters each team had and whether its goalie was in net. A late pull is any stretch in the last six minutes of the third period when the trailing team’s net was empty, counted once per game and team, from the score at that moment. The time we sort by is the first shot attempt, by either team, with that net empty, so the actual pull came a little earlier. A delayed penalty also takes a goalie off for a sixth skater, and the few that fall in a late deficit are counted too. Pulls in overtime are left out. All 2,624 regular-season games are in, including the ones decided in a shootout.
Every game’s shots are on its own page, and the league’s are on the shot maps and expected goals pages.