


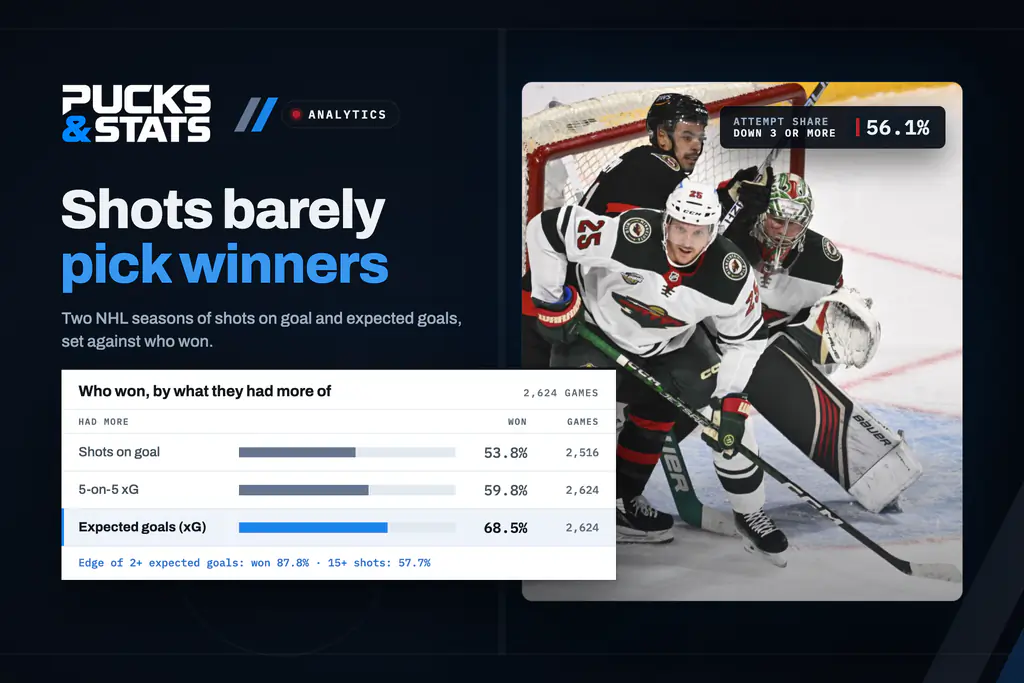
Shots on goal are the first number under the score in a box score, and the quickest way to say who carried a game. They are a poor guide to who won it. Over the last two regular seasons, the team with more shots on goal won 1,353 of the 2,516 games in which one side had more, 53.8%. The team with more expected goals won 68.5%.
More shots, a few more wins
Even a clear edge in shots says little. Teams that outshot the other side by one to four won 51.7% of the time, and by five to nine 51.0%. Only at ten or more did the number move, to about 58%.
| Edge in shots on goal | Games | Team with more won |
|---|---|---|
| 1 to 4 | 810 | 51.7% |
| 5 to 9 | 823 | 51.0% |
| 10 to 14 | 500 | 58.6% |
| 15 or more | 383 | 57.7% |
| All | 2,516 | 53.8% |
The score changes how teams play
The reason is score effects. A team that falls behind pushes, and a team in front protects what it has. At 5-on-5 over the two seasons, teams trailing by one took 53.5% of the shot attempts, by two 55.3% and by three or more 56.1%. A team that scores early can spend the rest of the night being outshot and still win. It is also why a team that falls behind late ends up pulling its goalie for a sixth skater, and the pull-the-goalie numbers show how often that works.
The Islanders were the clearest case. In the 72 games they were outshot, they won 44, 61.1%. In the 85 games they outshot the other team, they won 31, 36.5%. Colorado outshot its opponent in 119 games, and in the 38 in which it was outshot it still won 24, 63.2%.
Expected goals do better
Expected goals weigh every unblocked shot attempt by its chance of going in, from where it was taken, how, and in what situation, using our own model. Add them up and you get what a team’s chances were worth. The team with more won 68.5% of the time, and the bigger the edge, the surer the result.
| Edge in expected goals | Games | Team with more won |
|---|---|---|
| Under 0.5 | 772 | 58.3% |
| 0.5 to 1 | 650 | 64.2% |
| 1 to 2 | 850 | 73.2% |
| 2 or more | 352 | 87.8% |
| All | 2,624 | 68.5% |
At 5-on-5 alone the team with more expected goals won 59.8% of the time. That leaves out power plays, and they decide plenty of games. Expected goals still miss a hot goalie or a shooter who beats the odds, so they never pick every winner. They tell you far more about who earned a result than the shot count does.
Every game recap on our scores pages carries its shot map and both teams’ expected goals. The league’s leaders are on the expected goals and shot maps pages, and every club’s totals on the team stats page.
How we measured it
We counted shots on goal, goals included, and added up expected goals for both teams in every regular-season game of 2024-25 and 2025-26, all 2,624, overtime included. In 108 games the two teams finished with the same number of shots, so the shot table covers the other 2,516. A win includes overtime and shootout wins. Shot attempts by score count every 5-on-5 attempt in regulation, blocked and missed shots included, from the score at the moment of the shot. Our expected-goals model was trained on the shots of these same two seasons, so the 68.5% describes them rather than forecasts new games; the methodology shows how the model does on games it never saw.