


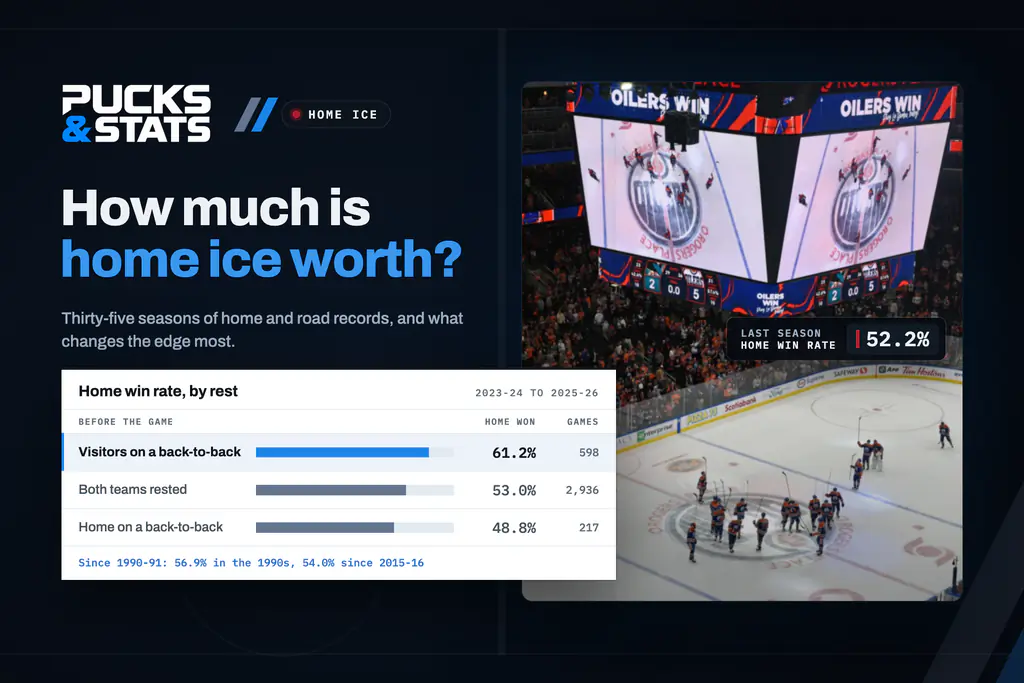
Home teams have won 55.1% of NHL games since 1990-91, counting the games that ended with a winner: 38,193 of them over 35 seasons. The edge is real, and it has been getting smaller. Home teams won 56.9% in the 1990s and 54.0% since 2015-16, and last season’s 52.2% was the second lowest of the 35.
Smaller than it was
Split the 35 seasons into eras and the home win rate drops in each one. The final standings of every season since 1990-91 are on the site.
| Seasons | Decided games | Home team won |
|---|---|---|
| 1990-91 to 1998-99 | 7,597 | 56.9% |
| 1999-2000 to 2003-04 | 5,294 | 55.8% |
| 2005-06 to 2014-15 | 11,790 | 55.0% |
| 2015-16 to 2025-26 | 13,512 | 54.0% |
The best season for home teams was 1991-92, at 62.1%. The worst was 2010-11, at 51.9%, just below last season. The goal edge has shrunk with it: home teams outscored their visitors by 0.71 goals a game in 1991-92 and by 0.13 last season.
Where the edge comes from
Over the last two seasons the home side took 51.8% of the expected goals in its games, and 51.3% at 5-on-5, a small but steady edge in the quality of chances. It scored 1,621 power-play goals to the visitors’ 1,439, about 13% more. And it scored first in 52.7% of games. That first goal was worth more at home, too: home teams that scored first won 69.6% of the time, road teams that scored first 63.0%. Shots alone say little about who wins, as two seasons of shots and expected goals showed.
It fades as the game goes on
In those two seasons home teams won 55.1% of the 2,027 games settled in regulation, 52.1% of the 401 settled in overtime and 49.5% of the 196 that went to a shootout. By the shootout the advantage is gone, and the visitors won slightly more often. Shootouts are their own story.
Rest matters as much as the building
Over the last three seasons, when neither team had played the day before, the home team won 53.0% of 2,936 games. When the visitors were on the second night of a back-to-back and the home team was rested, the home team won 61.2% of 598. Flip it, a home team on a back-to-back against rested visitors, and the home team won 48.8% of 217, so the visitors won slightly more than half. When both teams had played the night before, the home team won 57.3% of 185. Which teams have the most back-to-backs this season matters more than it looks.
Who uses it best
Over the same three seasons Columbus had the biggest gap between home and road: it took 58.5% of the available points at home and 41.9% away. Carolina was next, 73.6% at home and 57.7% on the road, then Calgary and Boston. Three teams did better away from home: Vancouver and New Jersey, each by 3.7 points of percentage, and the Rangers by 1.6. Every club’s numbers this season are on the team stats page.
How we measured it
The long view adds up every team’s home and road record from the final standings of each regular season since 1990-91, 35 seasons in all, with no 2004-05 season. A decided game is one with a winner, so ties, which ended after 2003-04, are left out, and overtime and shootout results count from 2005-06. Shot quality, power-play goals, first goals and how games ended come from every regular-season game of 2024-25 and 2025-26, 2,624 in all. The rest comparison uses every game of 2023-24 to 2025-26, and a team is on a back-to-back when it played the day before. The team comparison covers the clubs that played all three of those seasons.