


NHL power rankings, October 12, 2026
All 32 teams ranked by our model, set every Monday morning once the weekend's games are final: points already banked plus the rest of the season played out 4,000 times from shot quality. This edition counts 86 games.
 Carolina Hurricanes5-1-1 · 11 pts · Up 1
- Projected
- 110 pts
- Playoffs
- 90%
- Strength
- 54.8
- Cup price
- 9.5%
 Vegas Golden Knights5-1-0 · 10 pts · Up 3
- Projected
- 107 pts
- Playoffs
- 86%
- Strength
- 53.6
- Cup price
- 7.5%
 Colorado Avalanche3-2-0 · 6 pts · Down 2
- Projected
- 105 pts
- Playoffs
- 82%
- Strength
- 53.6
- Cup price
- 13%
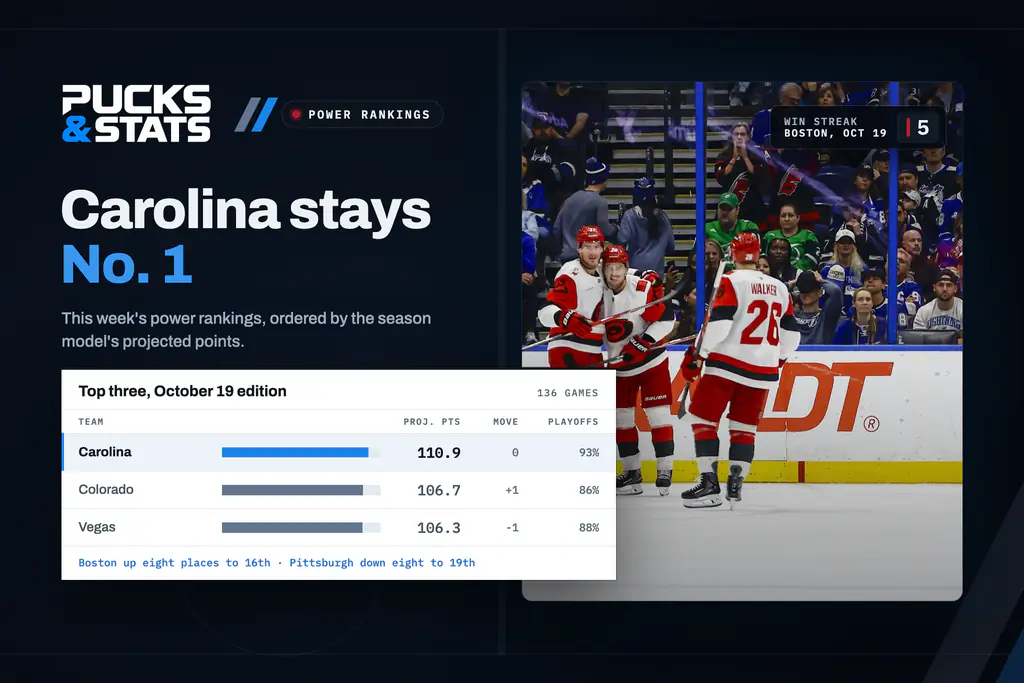
Carolina is first, Chicago last
Ranked by projected points; the move is against the preseason order. The Cup price is the cross-venue prediction-market average, next to our own numbers.


Model run Oct 11, 10:08 PM ET. Strength: 50 is an average team. Projected points: tap or hover for the range that 80% of simulated seasons end in.
Who is winning, and who is winning the shots
Points percentage across, share of expected goals up. The shaded corner is above average on both. Teams far to the right of where their shots put them tend to come back, and the model ranks them with that in mind.
Early in the season a team has played only a handful of games, so a dot can move a long way in a night.
The weekly column

How the power rankings work
- The rank
- Each team's projected points for the full 84-game season: the points it has already, plus the rest of its schedule played out 4,000 times by our season model. Ties go to the stronger team.
- Strength
- The model's rating: a team's share of expected goals, this season on top of last season counted as 30 games and pulled most of the way back to average, because last season says less about this one than it seems. 50 is an average team; every point above 50 is a real edge over a season. Each simulated season also varies every team's strength a little, so the chances allow for how much is still unknown.
- Shot share
- This season only: the share of expected goals in a team's games, from the quality and location of every unblocked shot. Above 50% means it is creating more than it allows.
- Playoffs and the Cup
- The share of simulated seasons in which the team makes the playoffs or wins the Stanley Cup. The Cup price next to it is what the prediction markets charge, which is a different question: a gap is a disagreement, not a tip.
- When it changes
- A new edition is set every Monday morning, once the weekend's games are final, and compared with the one before. Between editions the Now line shows where a team would rank after the latest results.
- Early in the season
- Until about 30 games, last season still carries much of the weight, so a hot start moves a team less than the standings do. That is deliberate: a few games say little about a team.
Every edition this season
- Edition 2, Oct 19, 20261. Carolina
- Edition 1, Oct 12, 20261. Carolina
Get the week in NHL numbers
One email a week: the power rankings, the numbers behind the biggest moves, the injuries that matter and where the markets disagree with our model.