


This morning the prediction markets give Washington a 98% chance of making the playoffs. Our model, which plays the rest of the season out 4,000 times from shot quality, gives them 45%. One of those numbers is going to look very silly by April. From today you can watch it happen, along with every other number in the NHL, on Pucks & Stats.
Pucks & Stats is live. The whole NHL season, every game, team and player, measured shot by shot, with the market prices right next to the numbers. If it happens on the ice, it’s on the site in minutes. Here’s the 37-second tour.
Goals tell you who won. Shots tell you what happens next.
The site at a glance
| Page | What you get |
|---|---|
| Games | Fair win probability, likely starting goalies, both teams’ shot maps, the head-to-head, a live page and a recap |
| Players | Game logs, a shot map of every attempt, career numbers and contracts |
| Teams | Form, lineup, special teams, skating speed, goaltending, cap space, injuries and every transaction |
| Stats | League leaders, expected goals and shot share for every team and player |
| Injuries | The league-wide report, checked every three hours |
| Transactions | Signings, waivers, recalls and both sides of every trade |
| Markets | Kalshi and Polymarket prices next to our season model |
| Power rankings | All 32 teams, every Monday morning |
Every game, puck drop to recap
All 1,344 games get their own page the day the schedule comes out. Before puck drop: fair win probability from US sportsbooks, the likely starting goalies, both teams’ shot maps and the head-to-head history. Once it starts, the score, the clock and every goal update by the minute. The recap lands within minutes of the final horn. Here’s tonight’s opener, and this card follows the game all the way to the final:
 Florida
 Buffalo
Every player, every shot
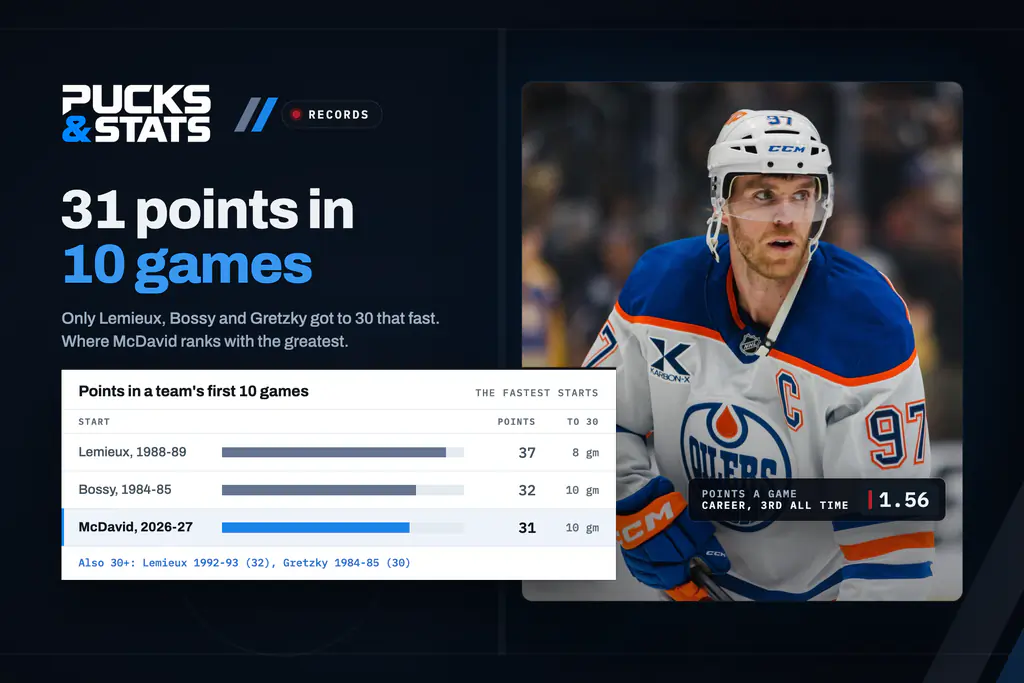
Player pages carry game logs, career numbers, contracts and a map of every shot they take. The points race updates after every final, and Connor McDavid woke up today at the top of it:
Most points, 2026-27
Stats hub →And here is where his goals come from, last season and this one, on a single rink:
Connor McDavid · 56 goals
Player page →Every team, inside and out
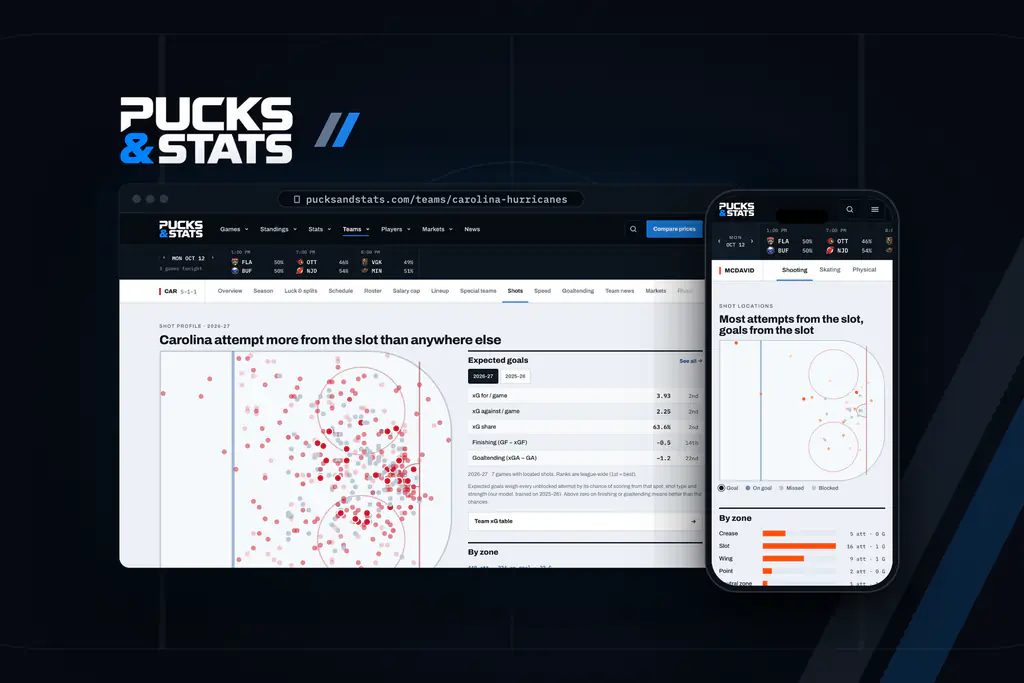
Team pages go deep: form, schedule, roster, lineup, special teams, skating speed, goaltending, cap space and expected goals by zone. Want to know why our power rankings put Carolina first and Chicago last? Put them side by side:
 Carolina2026-27Chicago

Points: Carolina 18, Chicago 6. Carolina ahead.
Every injury, every move
We check the league’s injury report and transaction wire every three hours and file every move under the team it hits: injured reserve, recalls, waiver claims, signings and both sides of every trade. Edmonton’s list, live:
Edmonton injury report
Team injuries →And the Rangers’ week, move by move:
Recent moves: NY Rangers
Team page →- Oct 19
Signed C Luke Glendening to a professional tryout agreement.
- Oct 17
Recalled F Jonny Brodzinski from Hershey (AHL).
- Oct 16
Recalled F Taylor Raddysh from Hartford (AHL). Assigned F Jaroslav Chmelar to Hartford.
- Oct 14
Assigned C Cole Beaudoin to Hartford (AHL). Recalled C Justin Dowling from Hartford.
- Oct 11
Placed G Igor Shesterkin on long-term injured reserve. Recalled C Gabriel Beaudoin from Hartford (AHL).
Where the money and the math disagree
Kalshi and Polymarket price the Stanley Cup, the playoffs, the divisions and the awards, and Market vs model puts every one of those prices next to our projection, in plain sight. The market has Florida at 10% to win the Cup; the model says 2.8%. The market gives Detroit a 15% shot at the playoffs; the model says 43%. A gap is a disagreement, not a tip, and we show our work on both sides. Florida’s Cup price, tracked every day:
Florida · Stanley Cup
Every Monday morning
Nora Halvorsen’s power rankings land every Monday: all 32 teams, ranked by the model, never by last night’s score. Carolina open the season at No. 1 and Chicago at No. 32. Sign up below and the weekly email brings you the rankings plus the week’s injuries, trades, signings and contracts.